Counting Tweets in R – Substrings, Chaining, and Grouping

I was recently sent an email about transforming tweet data and presenting it in a simple way to represent stats about tweets by a certain category. I thought I would share how to do this: A tweet is basically composed of text, hash tags (text prefixed with #), mentions (text prefixed with @), and lastly […]
Why we die – Mortality in Kuwait with R
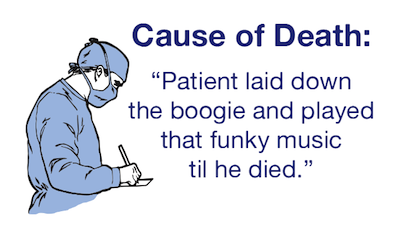
I came across Randy Olson’s (editor at @DataIsBeautiful) tweet about causes of death in the US. I thought I would replicate the information here using R and localize it for Kuwait – nothing fancy. I will keep the code to the end because I think the results are quite interesting. The data source is from […]
Price Elasticity with R

Scenario We covered Price Elasticity in an accompanying post. In this post we will look at how we can use this information to analyse our own product and cross product elasticity. The scenario is as follows: You are the owner of a corner mom and pop shop that sells eggs and cookies. You sometimes put […]
Overweight in Kuwait – Food Supply with R

Disclaimer I cannot say this enough … I have no idea about nutrition. In fact, if one were to ask me for a dietary plan it would consist of 4 portions of cookies and 20 portions of coffee. The reason I am doing this is to practice and demonstrate how to do some analysis with […]
Overweight in Kuwait – BMI with R
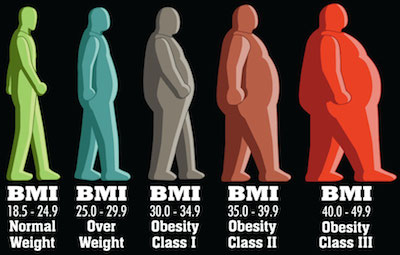
Inspiration Let me open with this: Faisal Al-Basri brings a lot of laughter into my life. It’s nothing short of a pleasure watching the political, social, and general satire on his instagram account. One particular post recently caught my attention – entitled: “Kuwaiti Women 2nd most obese world wide”. In his own words: Instagram (Rough) […]
Kuwait Sugar Consumption with R
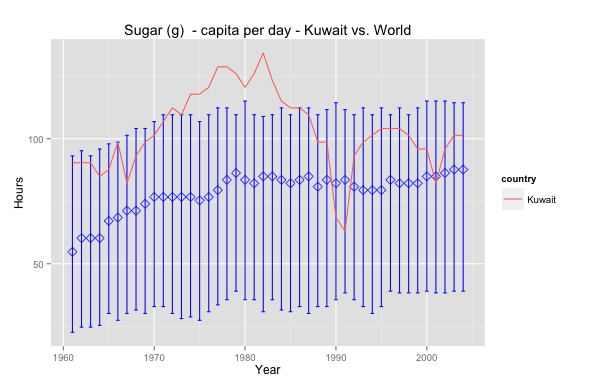
I was doing Facebook’s Udacity Explorartory Data Analysis course and one of the tasks is to use GapMinder.org’s data to visualise data. So I picked sugar consumption per capita per day; diabetes is a subject that has always been close and interesting to me. The graph above shows Kuwait’s sugar consumption relative to world averages. […]
Install R Package automatically … (if it is not installed)
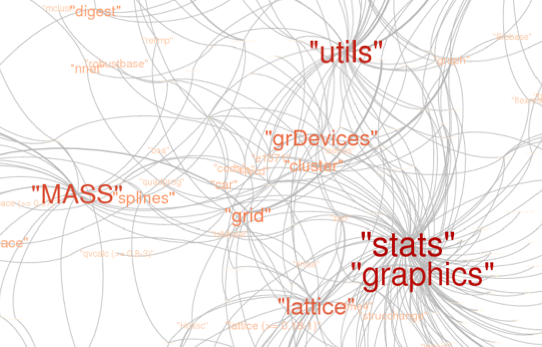
This is perhaps my favourite helper function in R. usePackage <- function(p) { if (!is.element(p, installed.packages()[,1])) install.packages(p, dep = TRUE) require(p, character.only = TRUE) }usePackage <- function(p) { if (!is.element(p, installed.packages()[,1])) install.packages(p, dep = TRUE) require(p, character.only = TRUE) } Why? Well … Have you ever tried to run a line of R code that […]
Tweet Bayes Classification: Excel and R

Foreward I started reading Data Smart by John Foreman. The book is a great read because of Foreman’s humorous style of writing. What sets this book apart from the other data analysis books I have come across is that it focuses on the techniques rather than the tools – everything is accomplished through the use […]
Customer Segmentation: Excel and R
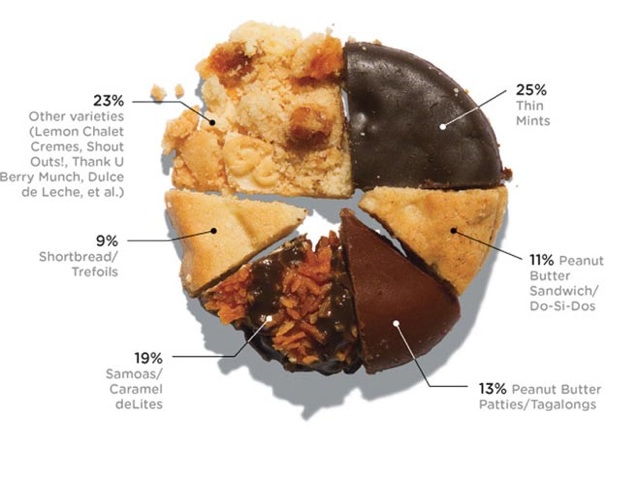
Foreward I started reading Data Smart by John Foreman. The book is a great read because of Foreman’s humorous style of writing. What sets this book apart from the other data analysis books I have come across is that it focuses on the techniques rather than the tools – everything is accomplished through the use […]
Collaborative Filtering with R
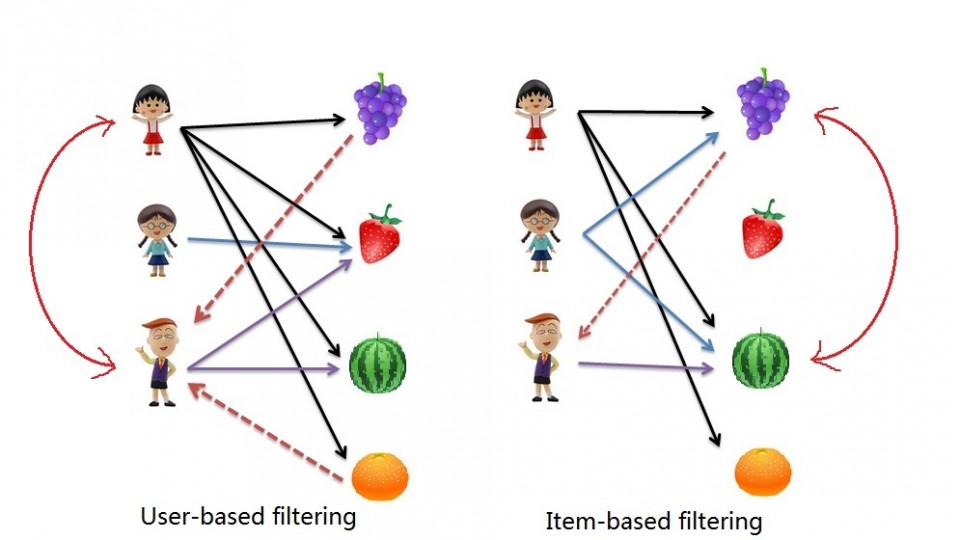
We already looked at Market Basket Analysis with R. Collaborative filtering is another technique that can be used for recommendation. The underlying concept behind this technique is as follows: Assume Person A likes Oranges, and Person B likes Oranges. Assume Person A likes Apples. Person B is likely to have similar opinions on Apples as […]
